
India’s Fiscal Report Card
In our best news reporter voice: Ye rahi aapki TEEN SAAL PURANI taza khabar!!
At ReadOn, we don’t just report the markets. We help you understand what truly drives them, so your next decision isn’t just informed, it’s intelligent.
That’s Punjab’s debt pile in 2025. For perspective, that’s larger than the combined debt of 12 Himalayan and North Eastern states put together.
And Punjab isn’t alone. Kerala has already burned through 85% of its annual fiscal deficit budget with three months still left in the year. Telangana and Andhra Pradesh exhausted their entire year’s deficit allowance in just nine months.
So when NITI Aayog released its Fiscal Health Index 2026 this week, ranking Indian states on their financial health. It’s essentially a fiscal report card that separates the states building for tomorrow from those struggling to pay yesterday’s bills.
Let’s break down what this means.
The Report Card Nobody Wants to Fail
The Fiscal Health Index is a comprehensive health checkup for state finances, measuring five critical vital signs:
Quality of Expenditure: Are states building roads and schools (capital spending), or just paying salaries and pensions (committed expenditure)?
Revenue Mobilisation: Can states generate their own tax revenue, or are they perpetually dependent on handouts from New Delhi?
Fiscal Prudence: Are deficits under control, or are states living beyond their means?
Debt Index: How much debt are states carrying relative to their economy?
Debt Sustainability: Can states actually service their debt without bankrupting themselves?
Based on these metrics, states get sorted into four categories. Achievers, Front-Runners, Performers, and Aspirationals. And yes, “Aspirational” is bureaucratic speak for “we’re concerned about you.”
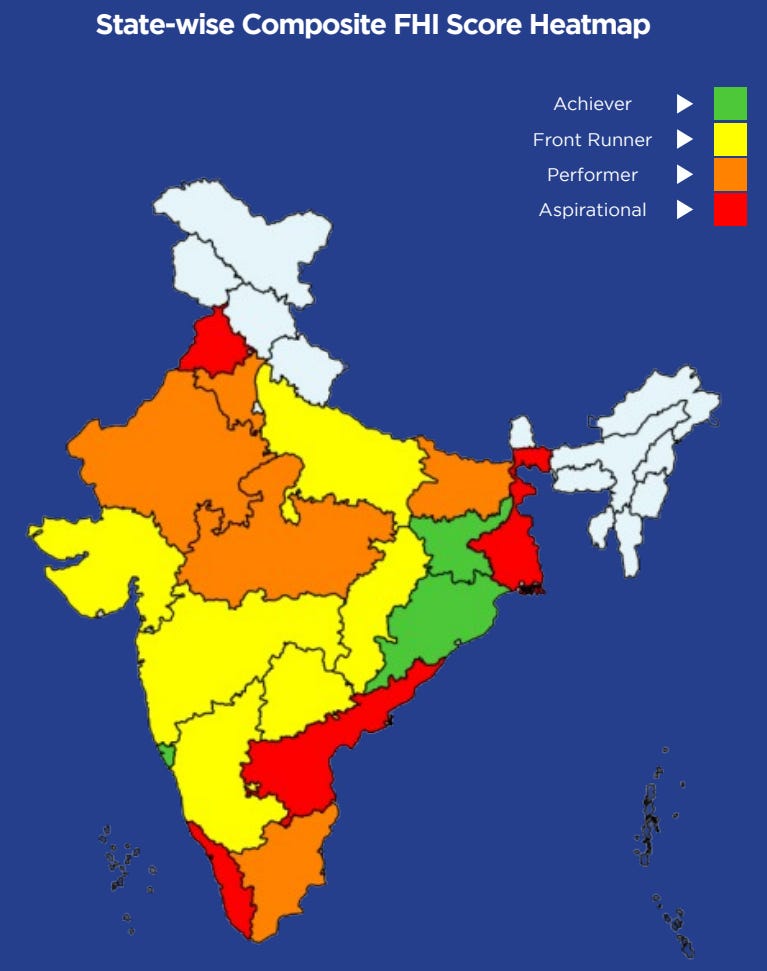
The 2026 edition evaluated 18 major states for FY 2023-24, plus 10 North-Eastern and Himalayan states (ranked separately because of their unique geographic and demographic challenges).
The Winners’ Circle
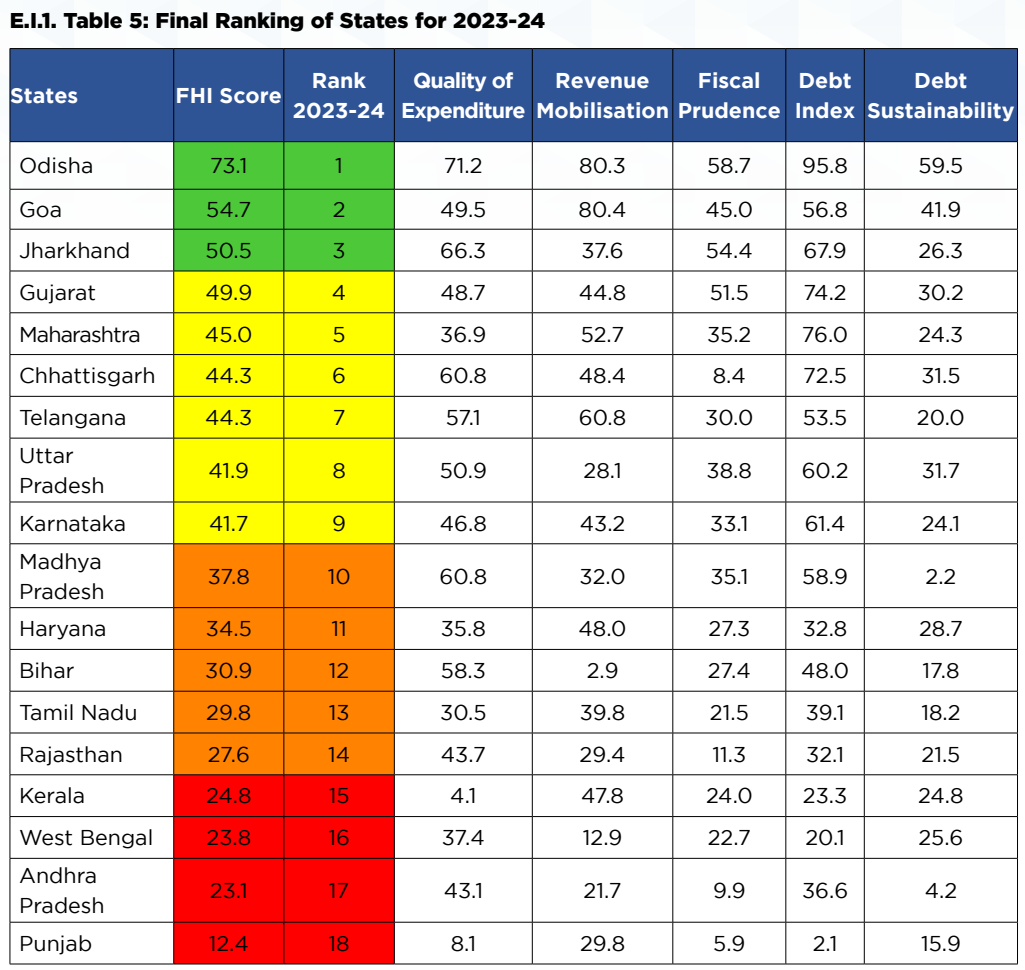
Odisha topped the rankings for the second consecutive year, followed by Goa and Jharkhand in the “Achiever” category. Gujarat, Maharashtra, Chhattisgarh, Telangana, Uttar Pradesh, and Karnataka made it to the “Front-Runner” group.
But what separates an Odisha from a Punjab? The numbers tell the story.
Achiever states share some common DNA:
Own-tax revenue above 60%: These states aren’t waiting for Central transfers. They’re generating serious money through their own tax collection. Odisha and Goa both exceed this threshold, giving them fiscal autonomy.
Capital outlay of 4-5% of GSDP: Instead of burning cash on recurring expenses, these states invest 4-5% of their state economy in infrastructure like roads, ports, power plants. That’s the stuff that generates future growth.
Fiscal deficit below 3% of GSDP: The Fiscal Responsibility and Budget Management (FRBM) Act sets a 3% limit. Achiever states respect it. They’re not borrowing recklessly to fund today’s consumption.
Debt levels under 25% of GSDP: Their total outstanding debt is manageable, at less than a quarter of their state economy. Compare this to Punjab’s over 48% debt-to-GSDP ratio and you understand the problem.
Contained interest burdens: When you’re not drowning in debt, you’re not drowning in interest payments either. This leaves more money for schools, hospitals, and infrastructure.
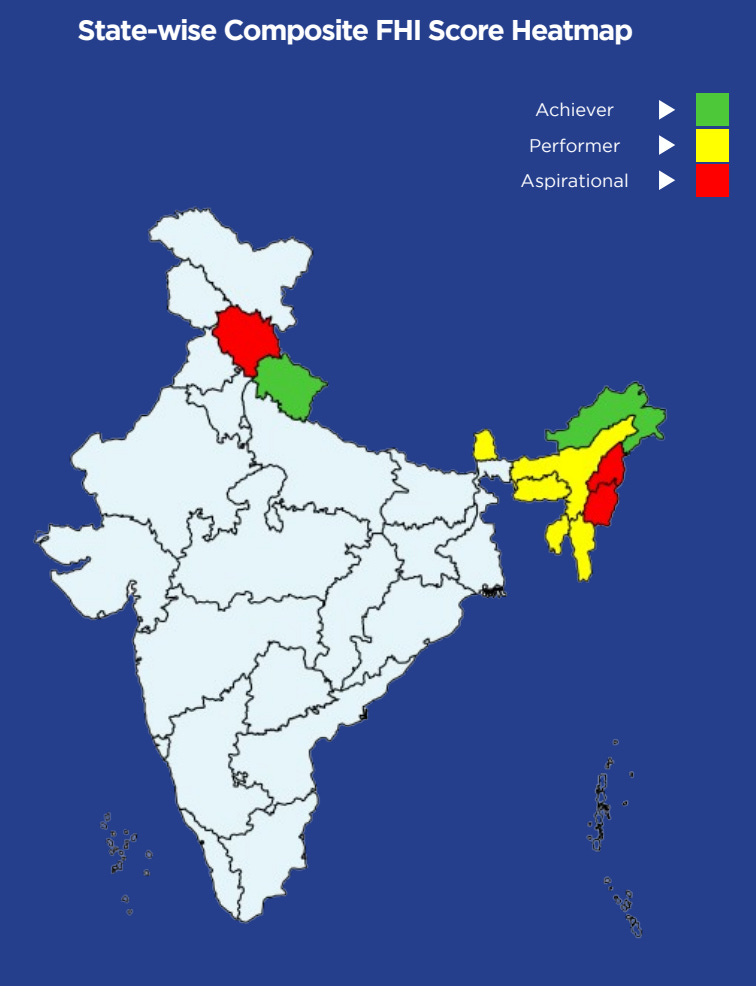
Among the North-Eastern and Himalayan states, Arunachal Pradesh and Uttarakhand emerged as Achievers, with Tripura, Meghalaya, Assam, Mizoram, and Sikkim in the Performer category.
What Went Right for the Winners
The secret sauce isn’t actually secret. It’s boring fiscal discipline. The kind that doesn’t make headlines but prevents crises.
Odisha’s mining windfall, managed wisely: Odisha benefits from mining royalties and premiums. But unlike some resource-rich states that blow the cash on populist schemes, Odisha has channeled this into non-tax revenue mobilization. About 21% of its total revenue comes from non-tax sources.
Gujarat’s revenue machine: Gujarat generates strong own-tax revenue and maintains a robust industrial base. Its manageable debt and deficit levels give it room to invest in infrastructure without triggering alarms.
Jharkhand’s capital expenditure focus: Jharkhand allocates significant resources to capital spending, the kind that builds assets rather than just paying today’s bills. This long-term thinking shows up in better developmental outcomes.
Goa’s high own-revenue capacity: With tourism and a strong tax base, Goa generates serious own-revenue, reducing dependence on Central transfers.
Meanwhile, the states at the bottom tell a different story. Punjab, Kerala, West Bengal, and Andhra Pradesh (the “Aspirational” category) face a toxic cocktail of problems:
Committed expenditure eating 50-60% of revenue receipts: Half their money goes to salaries, pensions, and interest payments before they even think about development.
Interest payments exceeding 15-20%: When you’re spending one-fifth of your revenue just servicing debt, that’s not sustainable—that’s a debt trap.
Fiscal deficits breaching FRBM norms: These states routinely exceed the 3% deficit ceiling, signaling persistent overspending.
Debt-to-GSDP ratios of 35-45%: Kerala, Punjab, and West Bengal are carrying debt burdens that constrain every other fiscal decision they make.
Kerala’s situation is particularly instructive. The state has exhausted 85% of its fiscal deficit budget by December, with three months still remaining in the fiscal year. Why? Because 75% of its revenue receipts go toward committed expenditures. That’s fiscal rigidity at its worst.
The Takeaway
But wait. The numbers don’t tell the whole story. Before we declare victory for fiscal prudence, let’s talk about the elephant in the room, or more accurately, the debt hiding off the balance sheet.
The Fiscal Health Index, for all its rigor, has one glaring blind spot: it doesn’t capture off-budget borrowings. These are loans taken by state-owned enterprises and special purpose vehicles that don’t show up in official deficit figures.
Consider Telangana. Its on-books debt looks manageable. But by 2021, its off-budget liabilities totaled ₹97,940 crore, which is nearly 10% of its state economy. Half of that came from just one project. It was the Kaleshwaram lift irrigation scheme.
Karnataka reported over ₹18,102 crore in off-budget borrowings in 2021, largely through irrigation and water supply enterprises. Andhra Pradesh’s State Civil Supplies Corporation borrowed ₹30,181 crore to manage essential commodities. This is debt that doesn’t appear in headline fiscal deficit numbers.
This matters because off-budget debt just postpones accountability. When these liabilities eventually come due, they create repayment crises that catch everyone off guard.
So yes, Odisha and Gujarat deserve credit for their fiscal management. But let’s not pretend the report captures the full picture. Until we account for hidden debt, we’re essentially celebrating a clean living room while ignoring the junk piled in the basement.
Editor’s Note: This report was released in March 2026, but it contains data for the financial year 2023-24. The Fiscal Health Index always runs on a lag. Which means that the report talks about how things were, not how they are. Hopefully, things are now better than they were three years ago.
Until next time, ReadOn!