

August may be the best time to buy stocks😲
August may be the best time to buy stocks😲
Really, we checked!
Now, we’re no fortune tellers nor do we have any magically aligned crystal ball to have come up with this.
But, we turned to the next best thing: numbers.
We traced the monthly Sensex prices for the last decade, and saw a pattern emerge in the movement of prices.
How did we go about it?
We calculated the price change rate for each month of the year by calculating the percentage increase or decrease in average prices as compared to the month before ((current month - previous month)/previous month %)
Take a look at the average monthly price change rate starting 2010. (To nullify the market volatility, we excluded 2020 from the calculation. Thanks, Covid).
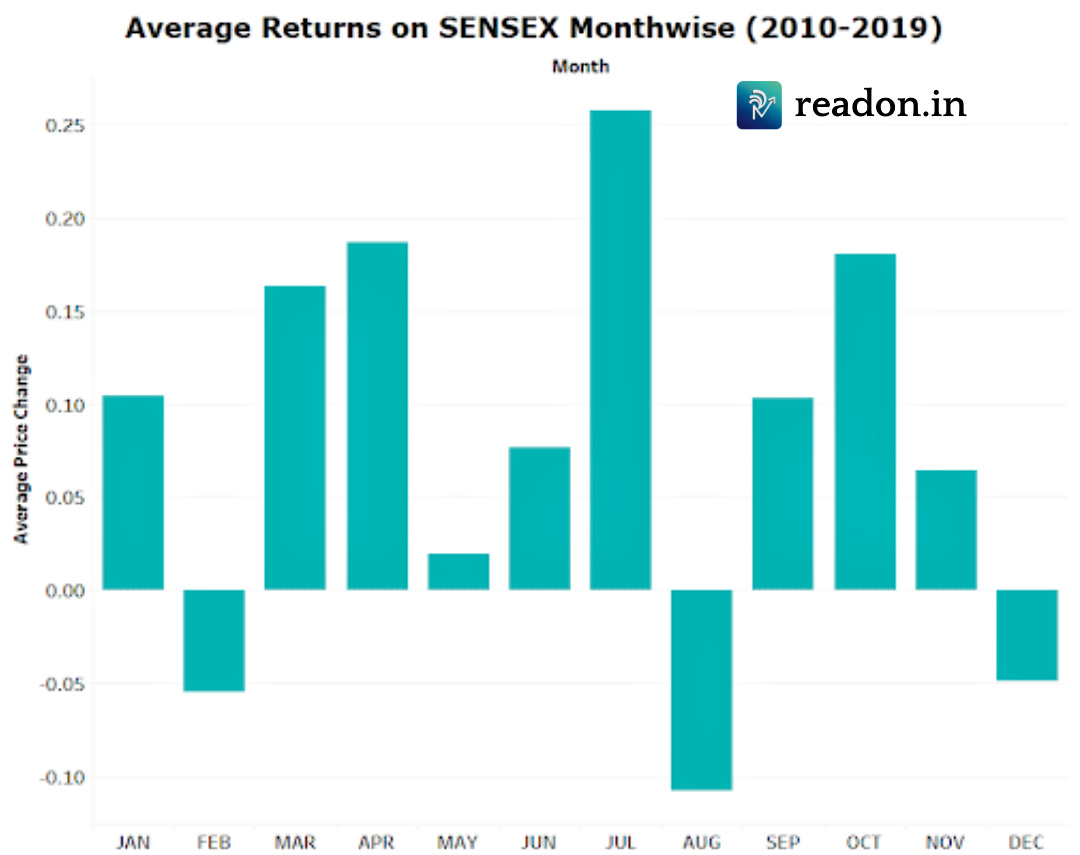
Data Source: BSE SENSEX Monthly Data
In the last 10 years, the average prices of each month have tended to peak in the month of July, following a strong pattern of falling prices in the month of August. You see where we are going with this?
Historically, August is generally a bearish month for investors. And that’s how you can take advantage of this trend: keep an eye for undervalued stocks and go on a share buying spree in August. But, is this merely a numerical coincidence or is the stock market really subject to seasonal changes?
What’s your theory on why this is happening?
Well, we got to digging. Was it because of any particular category of stocks or any particular class of shareholders that have been demonstrating this behaviour?
Here’s what we found.
These changes in the month of August were eerily correlated to investors’ behavioral bias, mainly Foreign Institutional Investors (FII) whose pattern of purchases and sales has shown a sharp increase in sales in the month of August causing a fall in prices.

Data Source: FII and DII Data fundata.in
The chart above illustrates the Average Net Sales and Purchases monthly in the period of 2010 to 2019. Still don’t believe us?

Now, aren’t you wondering, why do FIIs sell in the month of August?
Maybe because FIIs and Mutual Funds tend to change their portfolios and give up on underperforming stocks by the end of the third quarter (many of the foreign nations follow the calendar year). At the end of the day they have customers to report returns to, right?
What’s your theory behind this super creepy pattern? Would love to know your thoughts!
Disclaimer: We don’t endorse August as the go-to month for investment, but the movement of the market and the possible cause and effect relationships that cause the same is certainly an interesting thought to consider.
Liked it? Let us know! Join us on WhatsApp, and share your feedback! 👇
Cool 🖤🖤